eegUtils: an R package for EEG
A few months ago I wrote a post about how there isn’t really a killer EEG analysis package for R, and that many of the things you typically want to do are not really implemented yet. So I’ve started to implement several functions myself and incorporate them into my own package, currently called eegUtils. I’ll maybe come up with a catchier name at some point before I get to the stage of trying to get it on CRAN.
So why am I doing this?
Clearly it’ll be a long time (if ever…) before it has even half as many features as the terrific MNE-Python, EEGLAB, and Fieldtrip. It’s by no means a replacement for them. But there are things about all of them that I find frustrating at times.
I like to learn how things work. When I started with EEG analysis, I was given a bunch of scripts that did time-frequency transformations and more or less left to it. The code wasn’t annotated at all, and I didn’t have a lot of Matlab experience, so I spent a lot of time just figuring out what it was doing at each step. Once I’d figured it out, I decided to ditch the custom scripts and moved to Fieldtrip for the added flexibility, power, and transparency they gave me.
These days I mostly use EEGLAB for pre-processing (in the time domain), but its method for running statistics at the group level - the STUDY mechanism - is painful to use and utterly opaque. I use Fieldtrip for time-frequency analysis and like that a lot. But both Fieldtrip and EEGLAB are in Matlab, and I absolutely hate trying to do nice plots and just general statistics in Matlab. MNE-Python is great, but again, I find it a bit opaque at times. In part it’s just that I have less familiarity with Python - I can use it, but I’m much more proficient in R.
One of the things I don’t like with any of the above is they are almost too big and too mature. When I want to do something they don’t do, I often find it hard or annoying to extend them, to work out what they’re doing and tweak it in the way I like. In the past I’ve found serious bugs which have taken considerable time to be fixed in the release versions, and the lack of progress over many years in some aspects that I would really like to be improved has got a little old.
So like anybody sensible, I’m writing my own package, because clearly I don’t have enough else to be doing.
I like R, a lot, and it’s really missing something like this. For me it feels a lot easier to implement some of the things I want to do with my EEG data in R than it does in Matlab, where I do most of my processing. Python I also like, but I’m not as experienced with it.
There’s a real gap for us R fans when it comes to EEG processing.
Here are a few things I’ve got working so far.
Topographical plots
I’ve made a function for topographical plots - it’s very easy to customise the output with different colour schemes, with or without contours etc.
library(eegUtils)
library(cowplot)

def_plot <- topoplot(EEGdat, time_lim = c(150, 200))
def_plot2 <- topoplot(EEGdat, time_lim = c(150, 200), contour = F)
def_plot3 <- topoplot(EEGdat, time_lim = c(150, 200), colourmap = "BrBG")
def_plot4 <- topoplot(EEGdat, time_lim = c(150, 200), colourmap = "BrBG", interp_limit = "head", r= 1.1)
plot_grid(def_plot, def_plot2, def_plot3, def_plot4)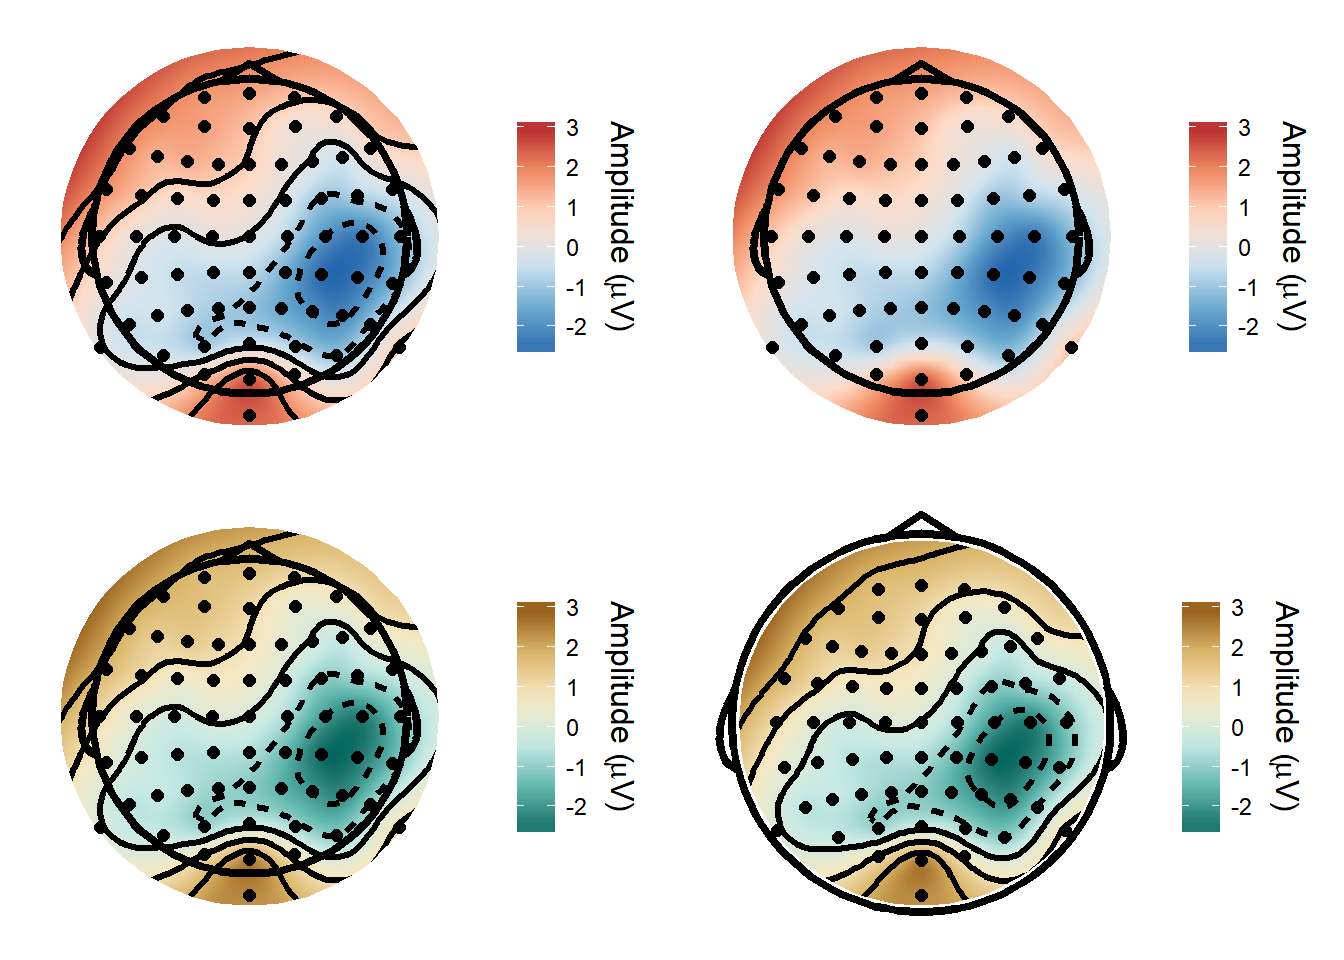
Plotting timecourses
I made functions to plot the ERPs of all electrodes, overlaid on a single plot, and from single electrodes, with separate lines for separate conditions.
plot_butterfly(EEGdat)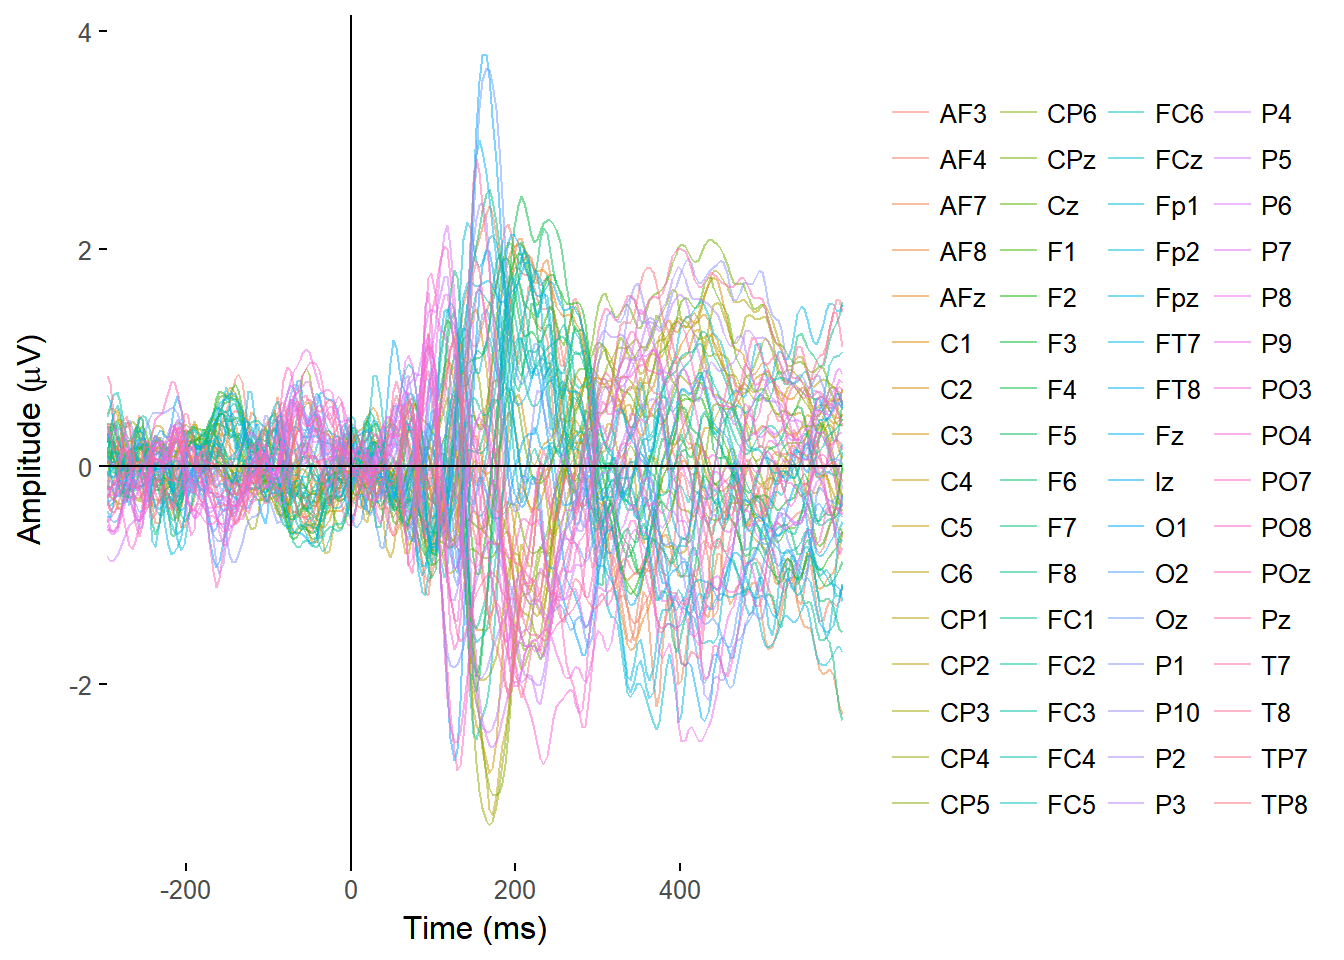
plot_timecourse(EEG_epochs, time_lim = c(-100, 350), electrode = "FCz", colour = "condition")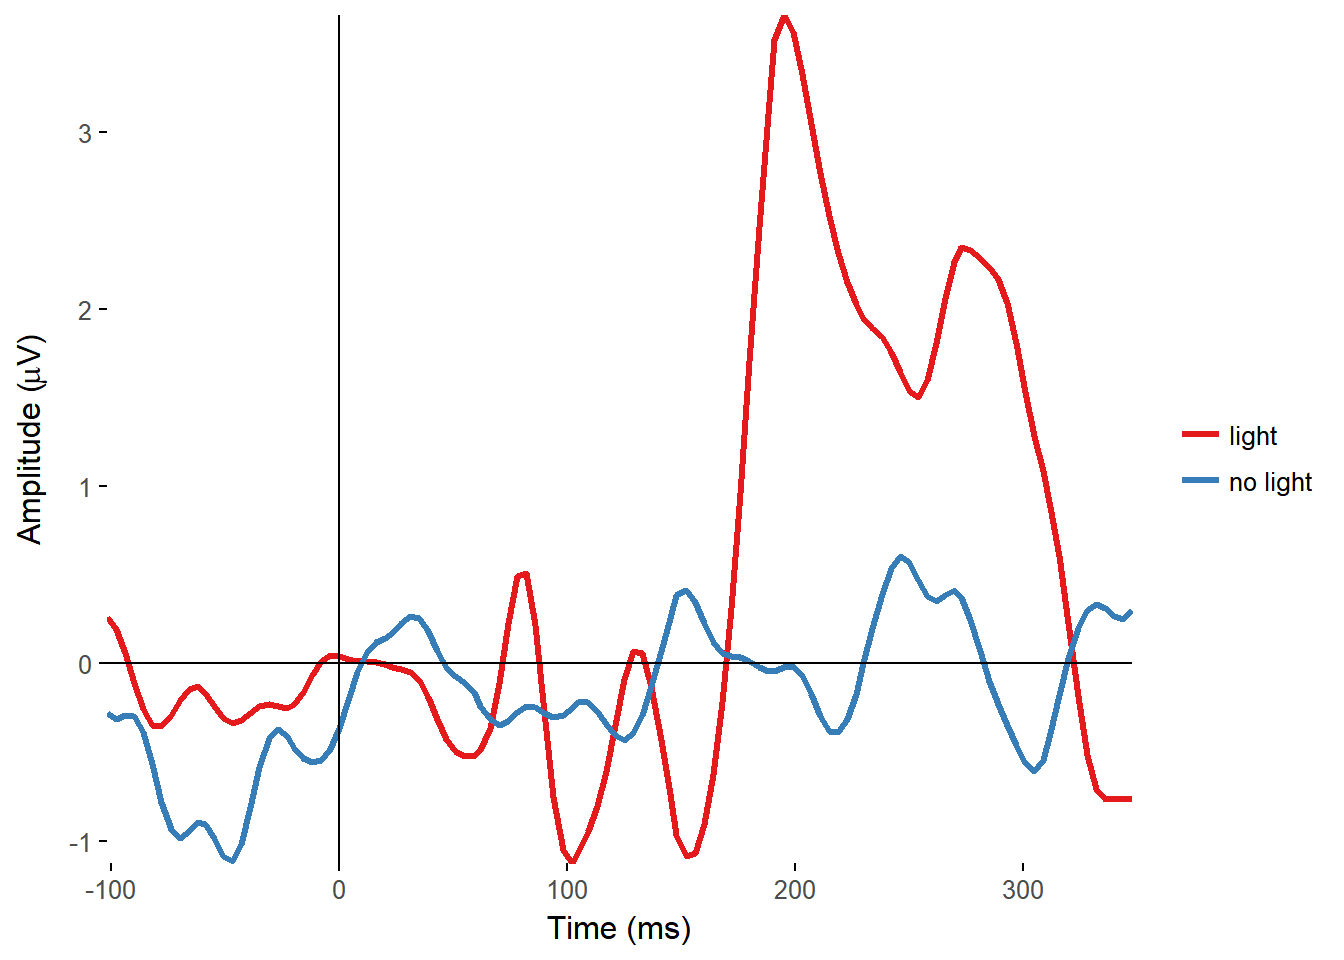
Topographically arranged plots
Matti Vuorre wrote a function (erp_scalp) to create topographically arranged plots of ERPs at every electrode. I integrated that into the package and created an interactive version that allows you to then select individual or multiple electrodes from that plot and see them in isolation.
erp_scalp(EEG_epochs, color = "condition")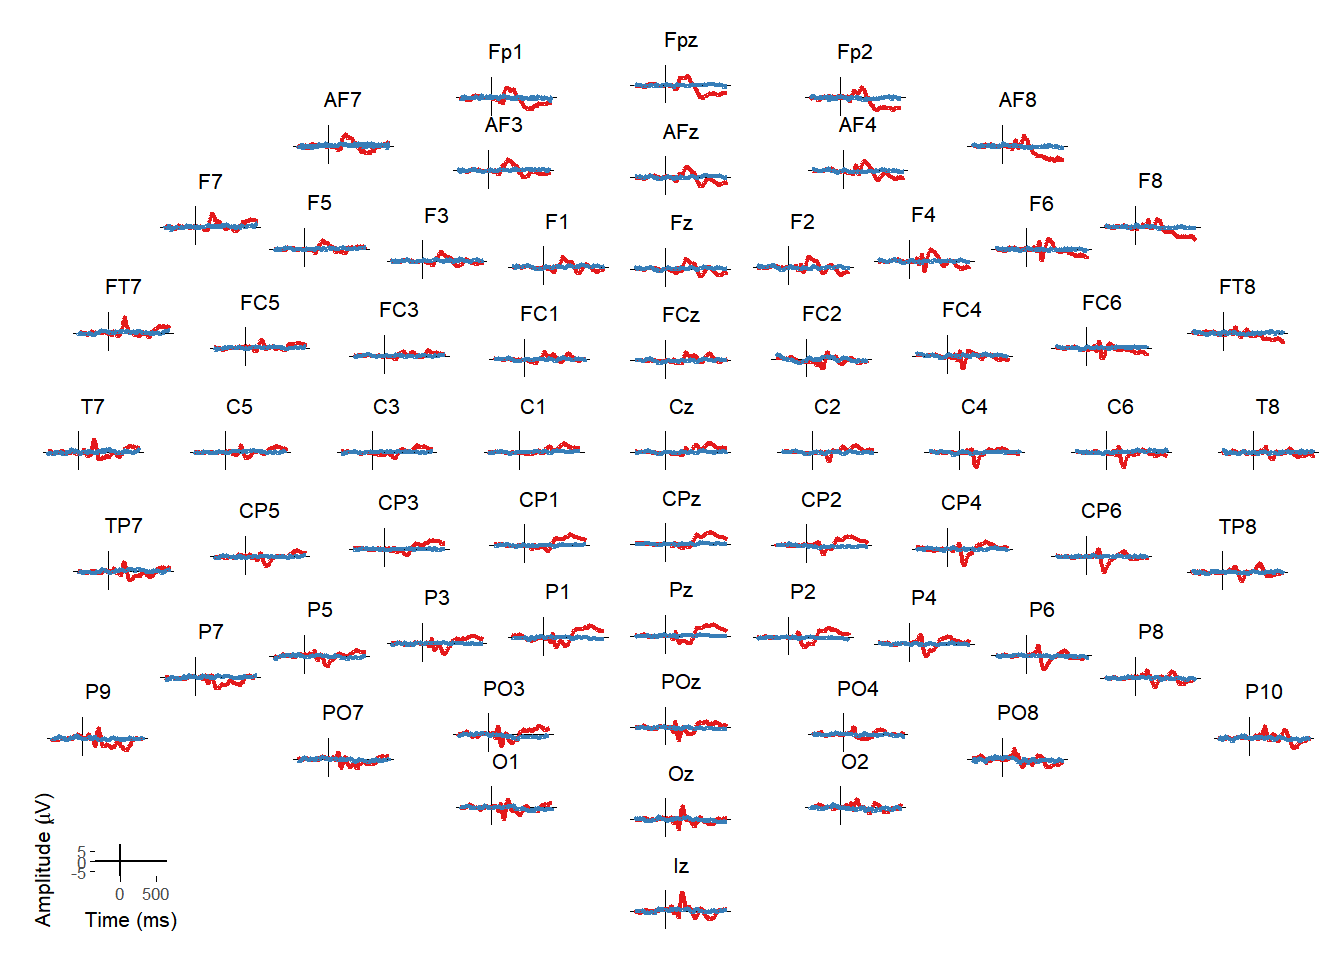
What next?
There’s a lot more to come. I’ve been working on data import (currently only for BDF/EDF, and only tested with BDF from BioSemi), referencing, and epoching functions. It’s been interesting learning a lot about R along the way so far, and I’m planning to add things like filtering and statistics. Sometimes I’m just creating wrappers around existing functions and making them more palatable for use with the kind of data I use. One of my goals with doing this is also to keep things as transparent as possible. A lot of these functions are based around things I’ve previously blogged about, making it easy for people to go back and see how they work without being tied to using my specific functions. In addition, I’d like to keep it so that it’s easy to put data into a generic format that can be used with essentially any R commands, so that it’s easy for people to use it in ways I never imagined and won’t have to support ;)
Matt Craddock
I'm a research software engineer