Updating eegUtils
As mentioned in my last post, I’ve been working on a package for EEG analysis in R called eegUtils. I’d mostly been focusing on relatively simple visualization tools: topographical plots - ERP Visualization: Creating topographical scalp maps: part 1. But one thing was really bugging me - how the data gets into R in the first place.
Sure, it’s nice pre-processing data in other packages - EEGLAB or MNE-Python - and then transferring the processed data across to R. And indeed those packages have a lot of features that are simply unavailable in R. It’ll be years before it catches up. But still, not all of those features are necessary. How far can we get with R alone?
Pre-processing and more
I primarily work with BioSemi EEG systems. It turns out there’s an R package, edfReader, available for R that can read BDF and EDF files. So there’s step one. But what about all the other steps you usually go through? I showed approaches to these filtering, referencing, and epoching in previous posts. How about building them into my package? So I did.
library(eegUtils)
library(tidyverse)
my_data <- import_raw("F:/Dropbox/BlogStuff/EEG_data/new_examp.bdf") %>%
select_elecs(c("EXG1", "EXG2", "EXG3", "EXG4", "EXG5", "EXG6", "EXG7", "EXG8"), keep = FALSE) %>%
reref_eeg(ref_chans = "average") %>%
iir_filt(low_freq = 0.1, high_freq = 40) %>%
epoch_data(201, c(-.5,.6))## Warning: reref_eeg has been renamed eeg_reference, and will be removed in a
## future version of eegUtils.In five lines of code, I’ve loaded a BDF, kicked out some channels I didn’t need, re-referenced to average reference, bandpass filtered the data from 0.1 Hz to 40 Hz, and epoched it around a specific trigger.
I can then plot all the electrodes at once with another line of code.
plot_butterfly(my_data, baseline = c(-.2, 0), time_lim = c(-.2, .5), legend = FALSE)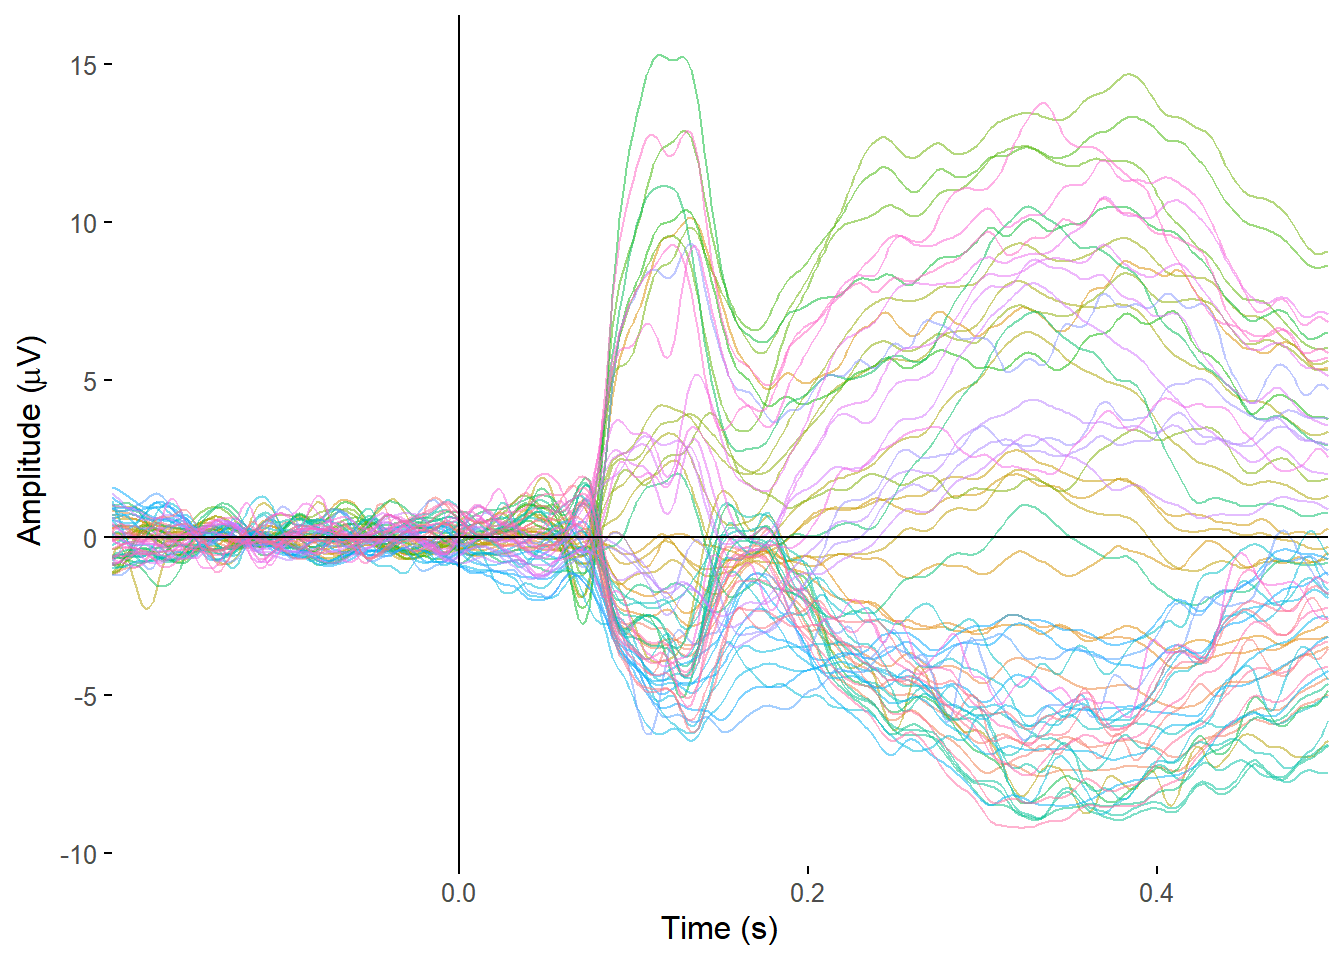
How about a topoplot? Here we go - note that I remove a couple of electrodes, because they had custom locations on the cap and I don’t happen to have the correct ones to hand (i.e. am too lazy to load EEGLAB and get them).
my_data %>%
  select_elecs(c("A15", "B20"), keep = FALSE) %>% # These electrodes were in custom locations, so removed them for now
  topoplot(time_lim = c(.1, .15), montage = "biosemi64alpha", method = "gam")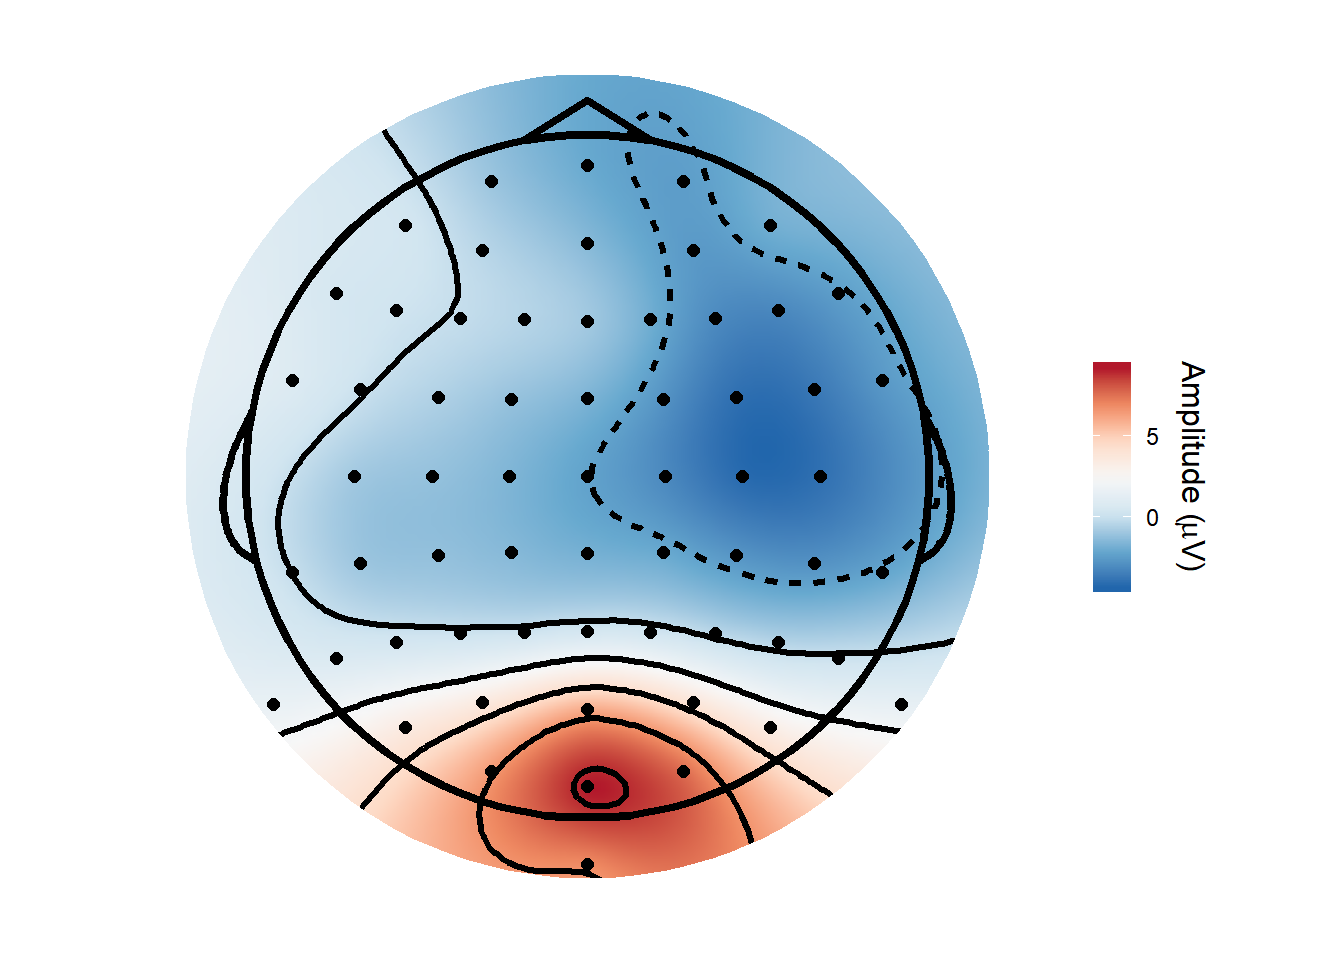
Or the timecourse of a single electrode.
plot_timecourse(my_data, electrode = "A25", baseline = c(-.2,0), time_lim = c(-.2, .5))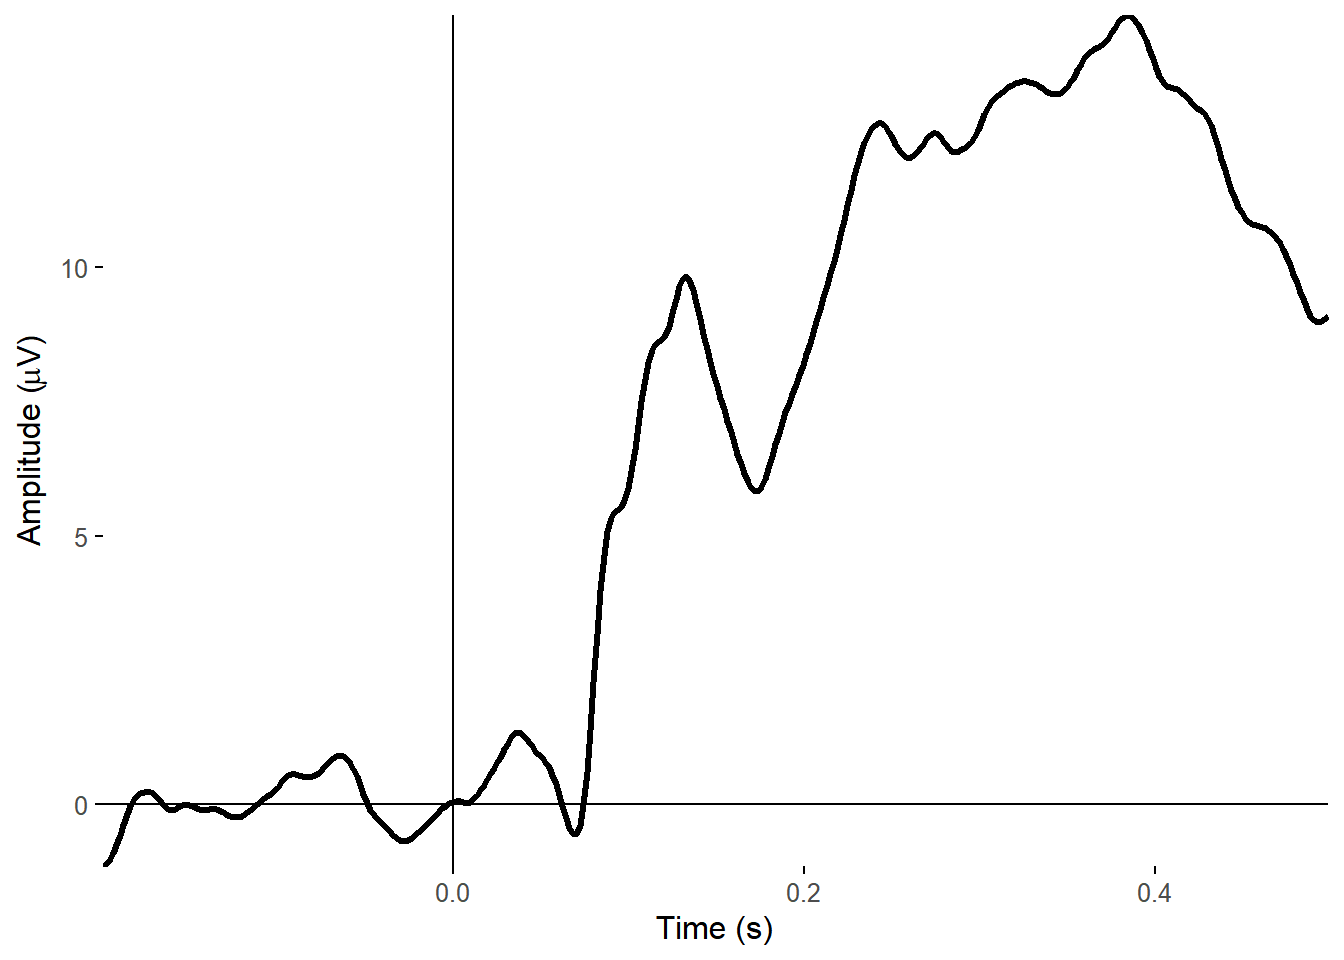
How about an EEGLAB style ERP image?
erp_image(my_data, electrode = "A29", clim = c(-20,20))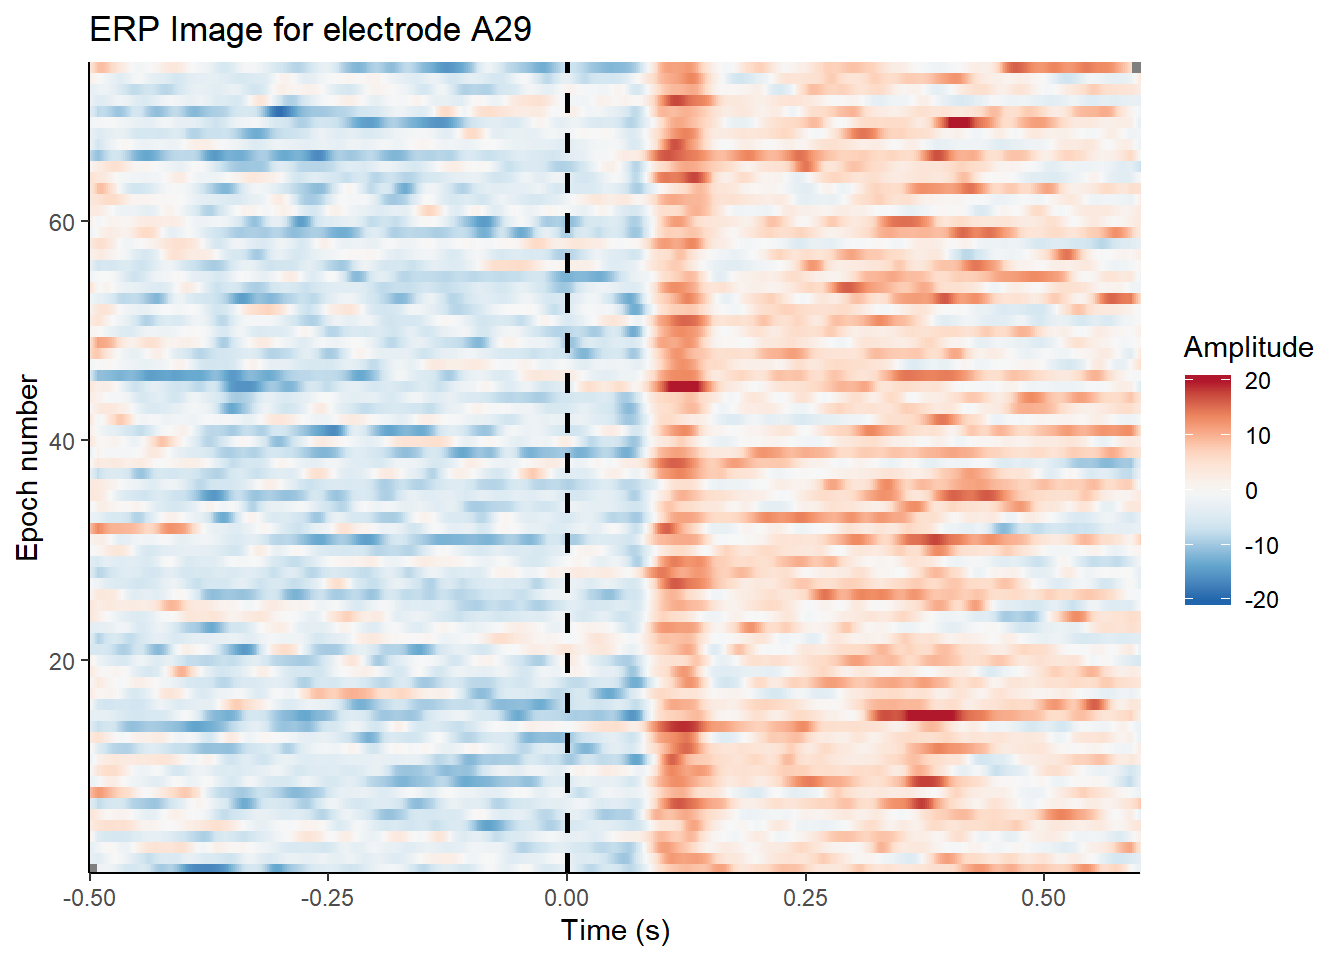 Or a plot of the whole scalp?
erp_scalp(my_data, montage = "biosemi64alpha")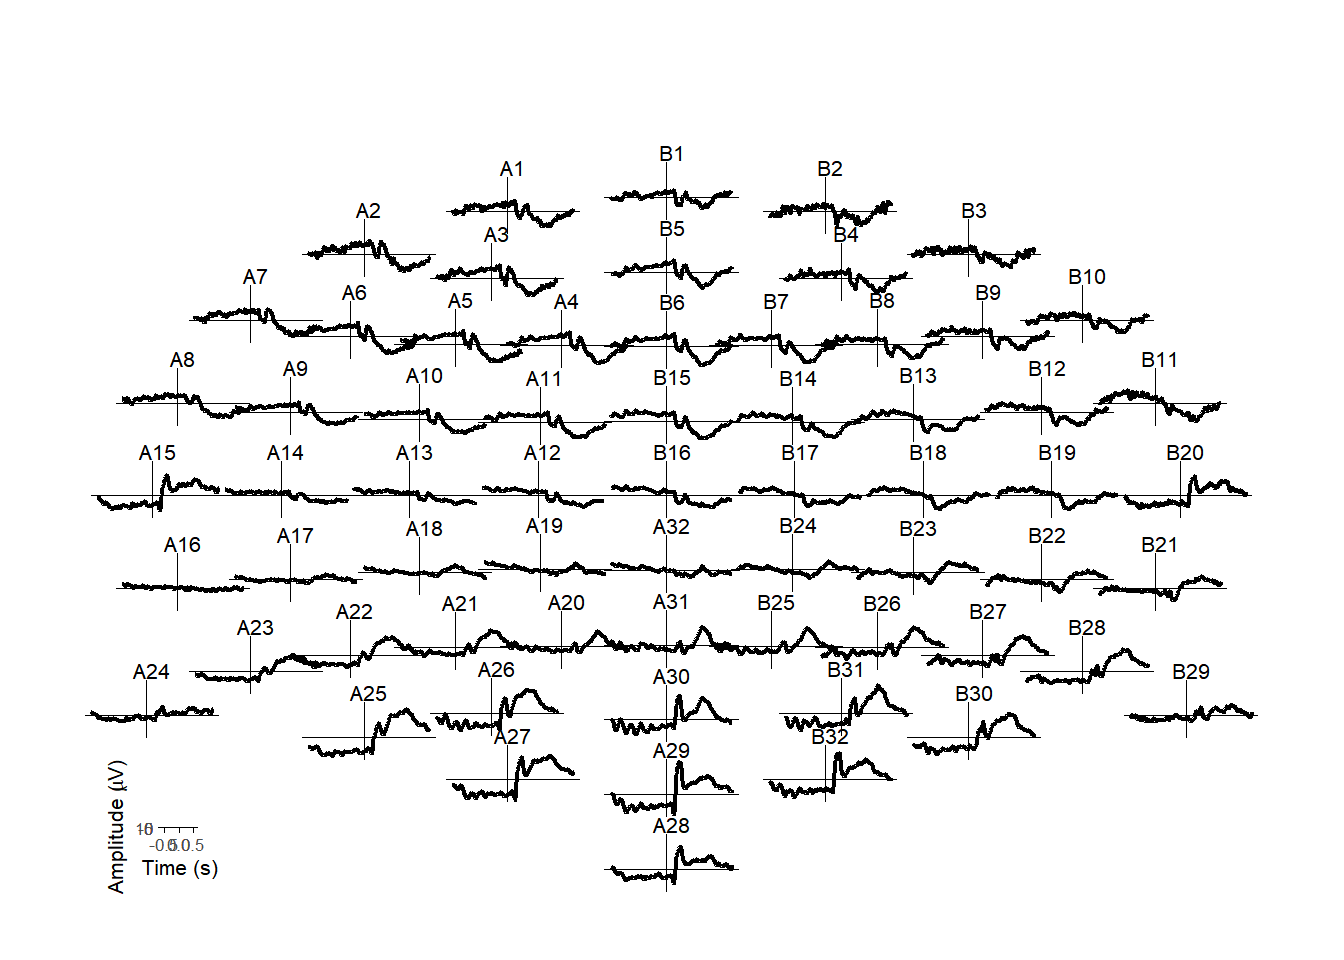
What have I let myself in for?
Turns out this process opened up a whole new can of worms. To prevent myself from constantly re-using code in different functions, I’ve created a bunch of interconnected functions that rely on each other internally. Changing one often breaks another. Sooner or later I’ll have to implement a testing regime to make sure everything works each time I tweak something.
In addition, to make dealing with new situations simpler, I’ve created a new class of S3 object - “eeg_data”. Essentially, an eeg_data object is a list of different things - one entry contains the channel data, another the referencing data, another a table of triggers and their timings, and so on. This enables me to individually address those things as and when I need them. In addition, it enforces a particular structure on the data, so that commands I write know where to look for what they need. The structure function import_raw() creates is a little like EEGLAB’s EEG structure, or MNE’s raw structures. I’ll write more about the S3 system later.
Of course, a custom class of object isn’t always easy to use: most existing commands only work on specific classes. So I created an as.data.frame() command to allow me to trivially create a dataframe from an eeg_data object, in a sensible format. Thus, I can use whatever R commands I like on it. Part of my original goal was to provide tools and scripts for people to use on their own data, and so many of the commands in my package work on both eeg_data and normal data frames, just switching the eeg_data objects to data frames as necessary.